Power quality testing logs the voltage and current at a point of connection or inside a site for days, then analyses the record for voltage magnitude and unbalance, harmonics, flicker, dips, swells, interruptions, transients and frequency. The instrument is a power quality analyser, and the exercise is also called a power quality survey, audit or monitoring. The result is judged against the connection agreement, the network's planning levels and the standards that apply at that point. This guide sets out what to measure, where the point of common coupling sits, how long to log, the safety framework for connecting to live switchboards, and how to judge the result.
Download the power quality testing guide (PDF)

Why measure power quality?
Because the shape of the supply decides whether plant runs hot, trips or fails early, and a logged week is the only evidence that shows which side of the connection point a problem is on. Schneider Electric's Cahier Technique 199 lists the effects of harmonics: overheating of transformers and cables, third harmonic current adding in the neutral, capacitor overload and resonance. It puts malfunctions as probable above 8% voltage THD and possible between 5% and 8%.
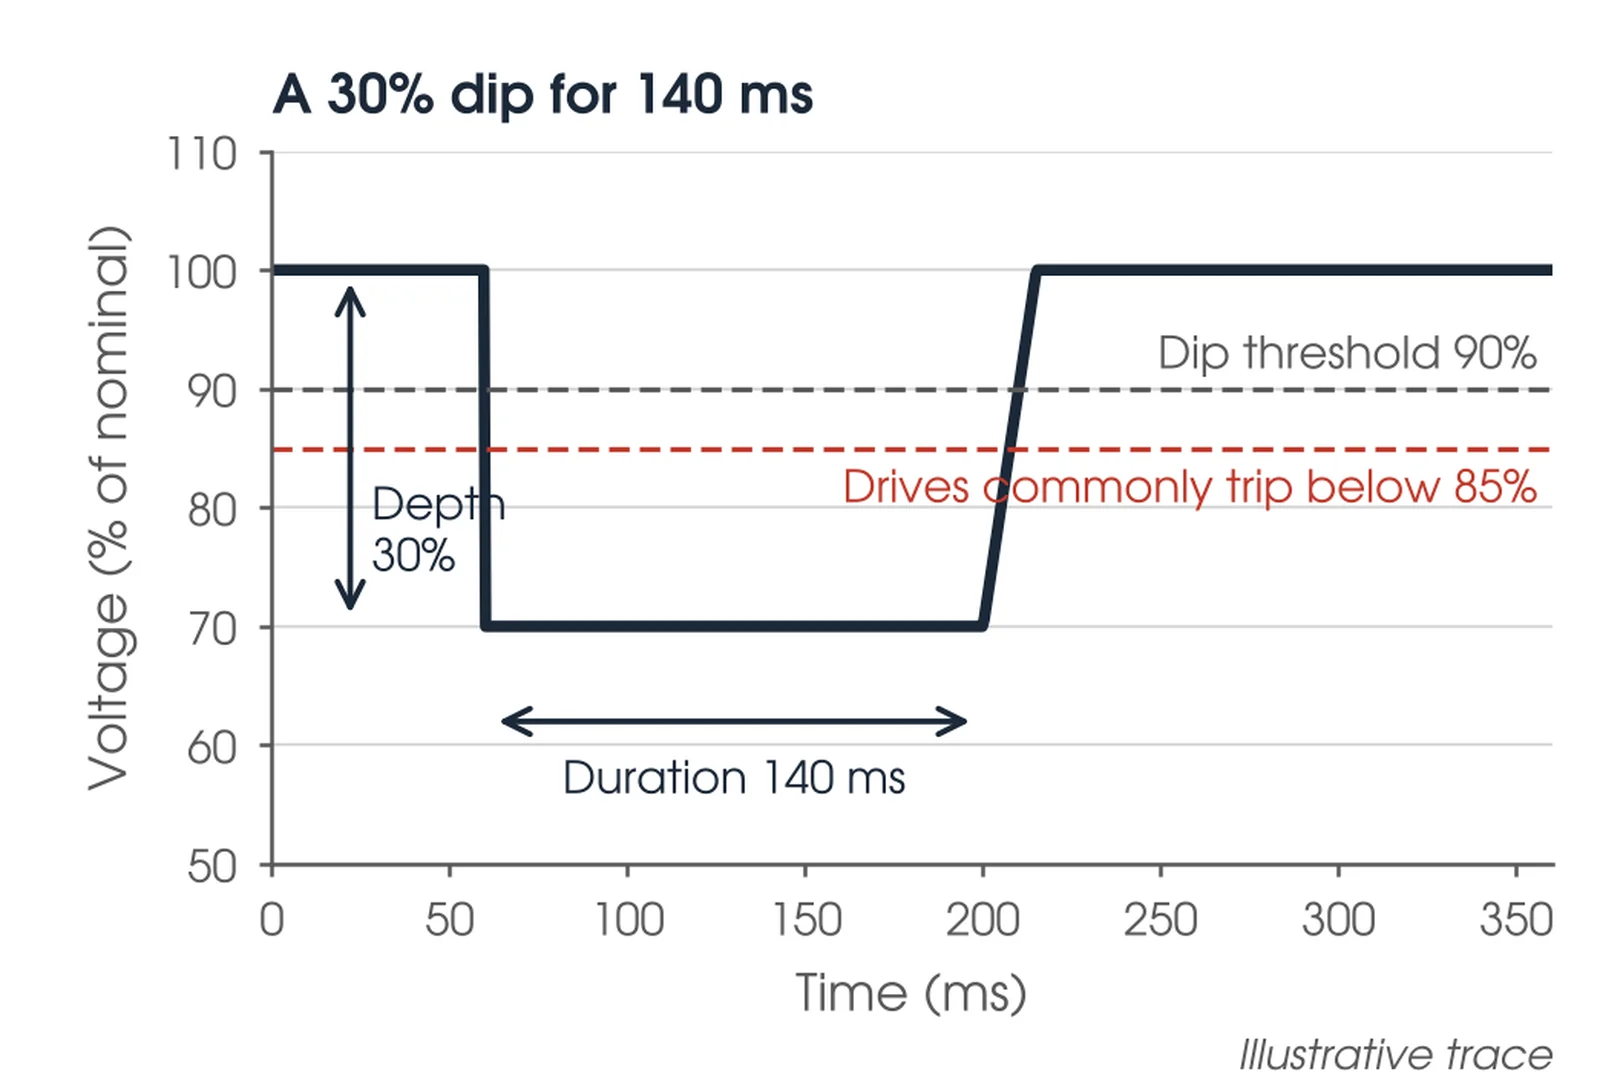
Dips stop processes. A dip is a fall below 90% of the reference voltage lasting a few cycles to a few seconds, characterised by depth and duration from the rms value calculated over one cycle and refreshed every half cycle. Schneider reports adjustable speed drives usually tripping on dips deeper than 15% and computer equipment being sensitive to dips deeper than 10%. Unbalance heats motors: negative sequence voltage drives negative sequence current that raises losses without doing work. IEEE 519-2022 makes harmonic control a joint responsibility, the user limiting current emission and the network limiting voltage distortion (Clause 5), so both sides need numbers they can compare.
When should power quality be tested?
At a connection application, where the network assesses the site's emissions against its planning levels; at commissioning of inverters, drives and new plant, as a compliance survey at the point of common coupling with the plant running; as a baseline week before any problem is reported; after a change to the site such as new drives, inverters, a UPS or a capacitor bank; and after an event, when nuisance trips, failures or flicker complaints need a cause.

Where is power quality testing used?
Anywhere a supply is shared or a sensitive load sits. The points below are the common ones, with what a bad result usually points to and the instrument class and duration that suit each.
| Measurement point | What a bad result points to | Instrument and duration |
|---|---|---|
| Point of common coupling with the network | Harmonic, flicker or unbalance emission outside the connection agreement or planning levels | Class A, seven days |
| Solar, wind or BESS inverter connection | Inverter harmonic emission, voltage rise at light load, flicker from cloud or wind variation | Class A, seven days plus event capture |
| LV main switchboard or site incomer | Supply voltage outside its range, dips and interruptions arriving from the network | Class A or Class S, seven days |
| Motor control centre with drives | Harmonic current from six-pulse drives, neutral current, resonance with capacitors | Class S, one to seven days |
| UPS, data and control supplies | Dips, swells and transients that match equipment resets | Transient capture, until the event recurs |
| Capacitor bank or power factor correction | Switching transients, harmonic amplification from resonance | Transient capture, days |
Where should the analyser go, and for how long?
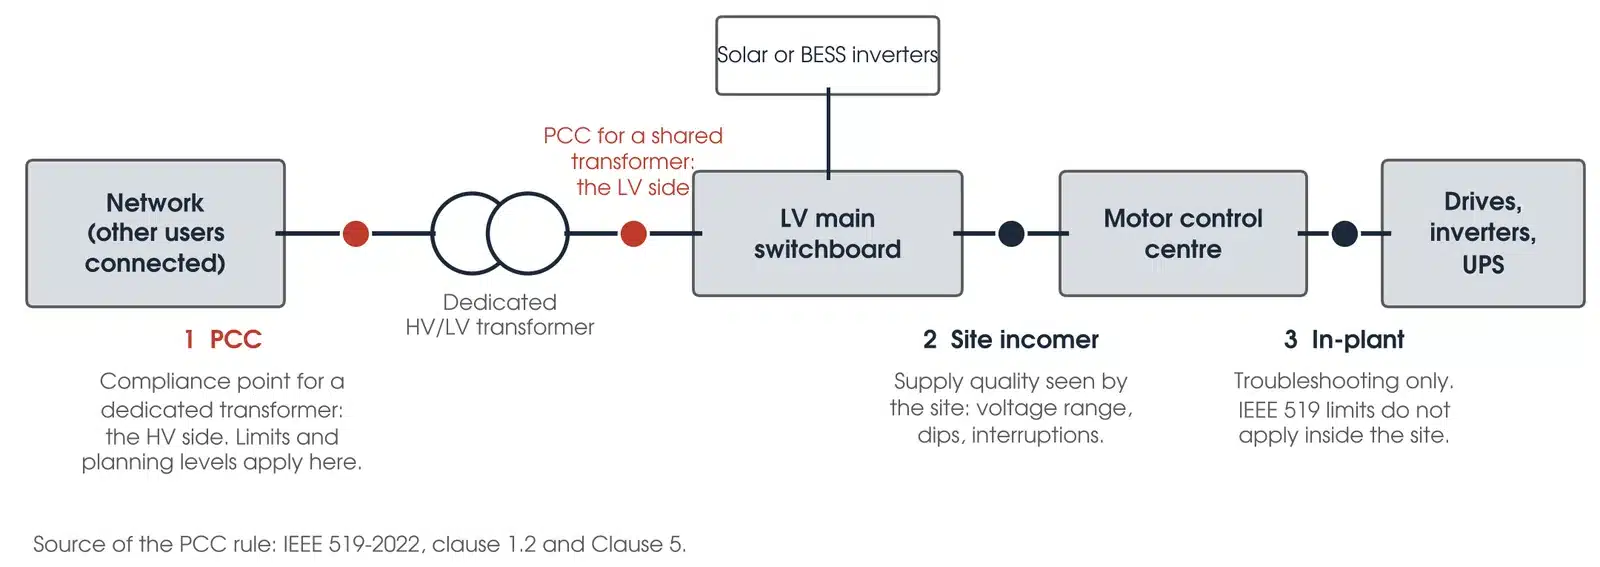
At the point of common coupling, for seven full days. IEEE 519-2022 applies its limits at the PCC only, not to individual equipment or inside the user's facility (Clause 5); for an industrial user on a dedicated transformer the PCC is the HV side, and for a commercial user on a shared transformer it is commonly the LV side (clause 1.2). Ten minute values are accumulated over one week and compared as the weekly 95th and 99th percentiles (clause 4.4), so with fewer than seven days the statistic does not exist. Schneider CT199 says a portable survey must cover the operating cycle of the plant, for example one week, and Fluke's guidance for an EN 50160 compliance check is also a full week. Our recommendation is seven full days at the PCC with a Class A analyser, 10 minute aggregation and event capture on, with in-plant loggers added for diagnosis rather than compliance.
A working day and a weekend behave differently: voltage rises at light load and harmonic current falls, so a two day log can pass on a Tuesday and fail on a Sunday. Log longer for intermittent events, with the trigger set to the complaint, and remember that seasonal loads such as heating and air conditioning change harmonic levels (Schneider CT199, clause 2.3) and that long term flicker Plt needs two hours per value. Keep a site diary of what ran and when, and set the analyser clock before logging; Class A compliance statistics are timestamped to UTC.
How is power quality measured?
A power quality analyser samples the voltage and current on every phase and computes each quantity the way IEC 61000-4-30 prescribes, so results from two instruments can be compared. The rms voltage is calculated over one cycle and refreshed every half cycle, which is how a dip of a few cycles is caught with its depth and duration (Schneider CT199, clause 2.2). Harmonics come from a Fourier transform over 10 cycles at 50 Hz, giving components every 5 Hz; each harmonic is the centre bin combined with its two neighbours, and the values are aggregated to 3 s and 10 min (IEEE 519-2022, clauses 4.1 to 4.3). Flicker uses the IEC 61000-4-15 flickermeter, Pst over 10 minutes and Plt over two hours, and unbalance is the negative sequence voltage as a percentage of the positive sequence (Schneider CT199, clause 2.6).
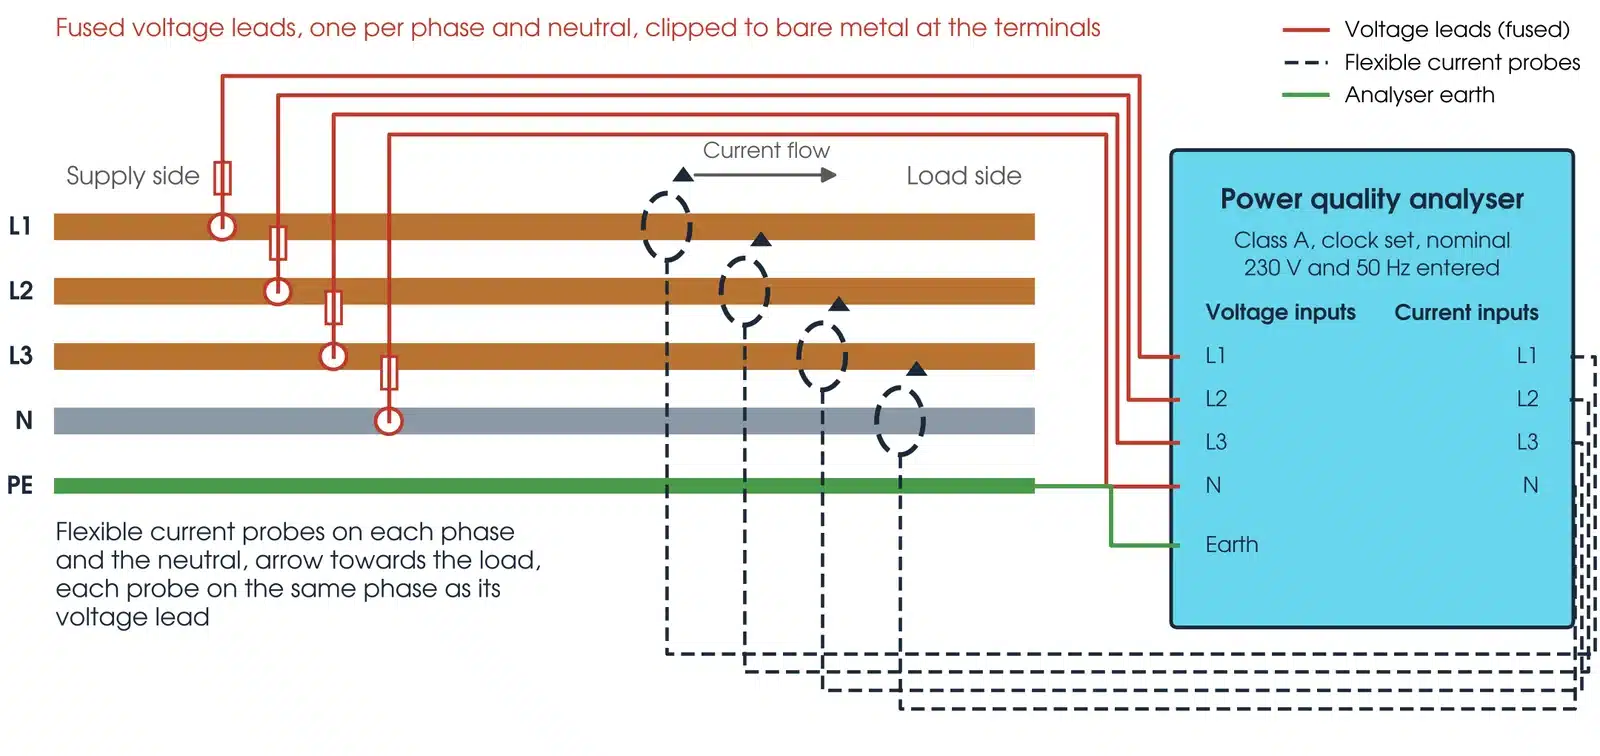
Two ratios matter. THD is the harmonic content as a percentage of the fundamental. TDD is the same content as a percentage of the maximum demand current IL, and it is TDD, not current THD, that IEEE 519 limits (clause 3.1). The connection follows from what is measured: one voltage lead per phase and one to the neutral, with the analyser earth to the switchboard earth bar, because line to neutral is what IEEE 519-2022 Table 1 limits; and a flexible current probe on each phase and the neutral with the arrow pointing to the load, because a reversed probe gives negative power and a wrong phase angle (Fluke). The current probe on L1 goes with the voltage lead on L1; a mismatch gives impossible power factors and wrong harmonic phase angles.
What does Class A mean?
Class A is the top measurement class in IEC 61000-4-30. As Fluke summarises it, Class A sets voltage accuracy at 0.1% of the declared input, fixes the aggregation intervals (10 cycles, 3 s, 10 min synchronised to UTC, and 2 h for Plt) and requires timestamps accurate to about 20 ms, so two Class A instruments agree and the result can be used in a compliance assessment or a dispute. IEEE 519-2022 Clause 4 requires a Class A instrument measuring at least to the 50th order; Class S instruments measure to the 40th and do not meet it. Run the analyser's wiring check before logging: fixing a reversed probe on a live board a week later costs the week.
How do I set up a power quality survey safely?
Connecting leads to live busbars is energised electrical work, and the hazards are arc flash and contact with the plant. The Safe Work Australia model code requires a recorded risk assessment, a safe work method statement and a competent person with tested tools and PPE, with a safety observer unless the work is testing only and the risk assessment shows no serious risk. Four things come before any lead is connected:
- Work under the asset owner's live work rules and switchboard access permit, with the point of isolation marked, clear and able to be operated quickly.
- Wear PPE rated to the incident energy at that board from the site's arc flash study. With no study, treat the board as high energy and raise it.
- Use an analyser and leads rated Category III or IV for the point of connection (SWA code, clause 8.4, citing AS 61010.1): fused voltage leads, shrouded clips, and probes that cannot bridge phases.
- Check the flexible probe's voltage rating against the busbar, keep the loop clear of adjacent phases, and fit it where a closing door cannot push it into a gap.
If the site's metering CTs are used instead of probes, the secondary must be shorted at the test block before any lead is moved; an open CT secondary produces lethal voltage. A logger left for a week is secured inside the cabinet or a locked enclosure, with the leads strain-relieved, the door closed and labelled, its supply confirmed and the permit contact left with the site. Clip to terminals and bars, never across a contact or a protection device, and do not interrupt a control supply to power the analyser. The test is for competent, authorised testing personnel working under the asset owner's safety rules; at Megavar that means assessed testers, with others under direct supervision.
Where do I measure on the plant?
At the PCC for compliance, at the site incomer to see the supply quality the site receives, and inside the plant only to find a source. For a dedicated transformer the PCC is its HV side; for a shared transformer it is the LV side. Limits and planning levels apply there, and a drive's terminal current compared with an IEEE 519 table misapplies the standard.
This guide describes general practice for competent HV testing personnel. It is not a work procedure. Work under the asset owner's safety rules, the access permit and a site-specific safe work method statement. Manufacturer and asset owner criteria take precedence over the general guidance here.
How do I test power quality?

- Plan and permit. Fix the measurement point, the limits to test against and the duration. Obtain the live work authorisation, the permit and the arc flash rating of the board.
- Configure. Enter nominal voltage and frequency, wiring type, probe range, Class A compliance mode, 10 minute aggregation, event thresholds and a start time. Set the clock.
- Connect. Earth first, then voltage leads, then current probes with arrows to the load, each on the same phase as its voltage lead.
- Verify. Run the wiring check: phase rotation, matching voltages and currents, power direction on every phase that fits the operating state and the declared import or export convention (a correctly wired export site can read negative), sensible power factor. Do not reverse a probe just to force a positive reading. Correct before logging.
- Log. Seven continuous days minimum. Secure the analyser, keep the site diary and check remotely or daily that it is still recording.
- Download and restore. Stop the record, download and back it up before touching a lead. Remove probes, then voltage leads, then earth, under the same permit conditions as connection.
- Analyse and report. Weekly 95th and 99th percentiles against the limits at that point, events matched to the diary, and the set-up recorded.
Record the probe serial numbers and ranges. A tenfold mismatch between the probe range and the analyser scaling gives a tenfold current error, high or low depending on which setting is wrong; check against an independent current reading before logging.
What are the common power quality testing mistakes?
| Mistake | What it does to the result |
|---|---|
| Reversed current probe | Negative power on one phase and wrong harmonic phase angles |
| Phase mismatch | Current from L2 paired with voltage from L1: impossible power factor, wrong direction of harmonic flow |
| Wrong nominal voltage | Dip and swell thresholds are set from the nominal, so events are missed or invented |
| Class S used for compliance | Not comparable with the network's instrument and not what IEEE 519-2022 Clause 4 requires |
| Too short | No weekly percentile, and the light-load weekend is missed |
| Wrong point | A drive's terminal current compared with IEEE 519 Table 2 misapplies the standard; the limits are for the PCC |
| Clock not set | Events cannot be matched to the diary or to the network's own records |
| Neutral not measured | Third harmonic current in the neutral, the common cause of a hot neutral, is not seen |
How do I read a power quality result?
A power quality result is a set of weekly statistics and a list of events, each judged against the limit that applies at the measurement point: the supply voltage range, the harmonic voltage and current tables, the network's planning levels for flicker and unbalance, and the site's own history. A result can sit inside every limit and still warrant action.
What limits apply?
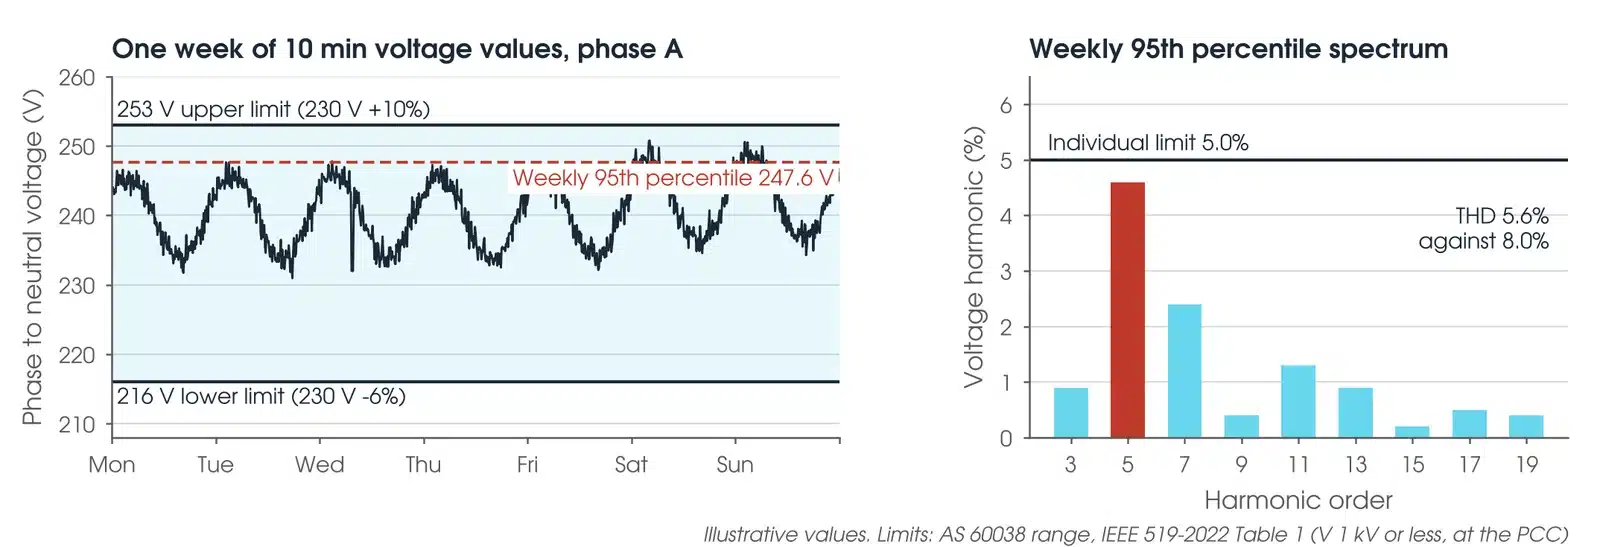
Steady-state voltage: AS 60038 sets the standard low voltage at 230/400 V with a margin of +10% / -6%, that is 216 V to 253 V, as stated by the Queensland Government in its 2017 voltage limits regulation; the same source gives AS/NZS 61000.3.100 a preferred range of 225 V to 244 V. The network's own connection standard governs.
Harmonic voltage at the PCC: IEEE 519-2022 Table 1 allows, for 1 kV and below, 5.0% per harmonic and 8.0% THD; from 1 kV to 69 kV, 3.0% and 5.0%; from 69 kV to 161 kV, 1.5% and 2.5%; above 161 kV, 1.0% and 1.5%. The weekly 95th percentile of 10 minute values must be below the table and the daily 99th percentile of 3 s values below 1.5 times it (clause 5.1). Harmonic current at the PCC: Tables 2 to 4 set limits in percent of IL by the short circuit ratio Isc/IL; for systems from 120 V to 69 kV the TDD limit runs from 5.0% at Isc/IL below 20 to 20.0% above 1000, with the weekly 95th percentile below the table, the weekly 99th below 1.5 times and the daily 99th below 2 times (clause 5.3). Generation facilities are held to the lowest row regardless of Isc/IL (note c).
Australian planning levels: TasNetworks publishes planning levels drawn from AS/NZS 61000.3.6 and the National Electricity Rules, including voltage THD of 7.30% at 0.4 kV and 6.61% at 11 kV to 33 kV load busbars, flicker Pst 1.0 and Plt 0.8 on the LV network, and the NER Table S5.1a.1 unbalance of 2.0% general at 10 kV and below. Other networks publish their own; use the one for the connection in hand.
What does a bad power quality result look like?
| Pattern | What it usually means |
|---|---|
| Voltage high at light load | Weekend and overnight voltage near or above 253 V with solar exporting: a network voltage or tap setting matter, raised with the network |
| 5th and 7th dominant | Six-pulse drives or rectifiers on site. Judge the likely source from synchronised voltage and current records, in-plant loggers and load changes; the apparent direction of a harmonic is a supporting indicator, not proof, where both sides contribute |
| 3rd dominant with a hot neutral | Single-phase electronic loads; triplen currents add in the neutral (Schneider CT199, clause 3.2) |
| Dips in clusters | Network faults and reclosing, often in storms. Match times to the network's event records |
| Interharmonics at a fixed frequency | Ripple control signalling on Australian networks uses 168 Hz to 1350 Hz (IEEE 519-2022, A.2.2); a network signal, not a fault |
Is my result OK?
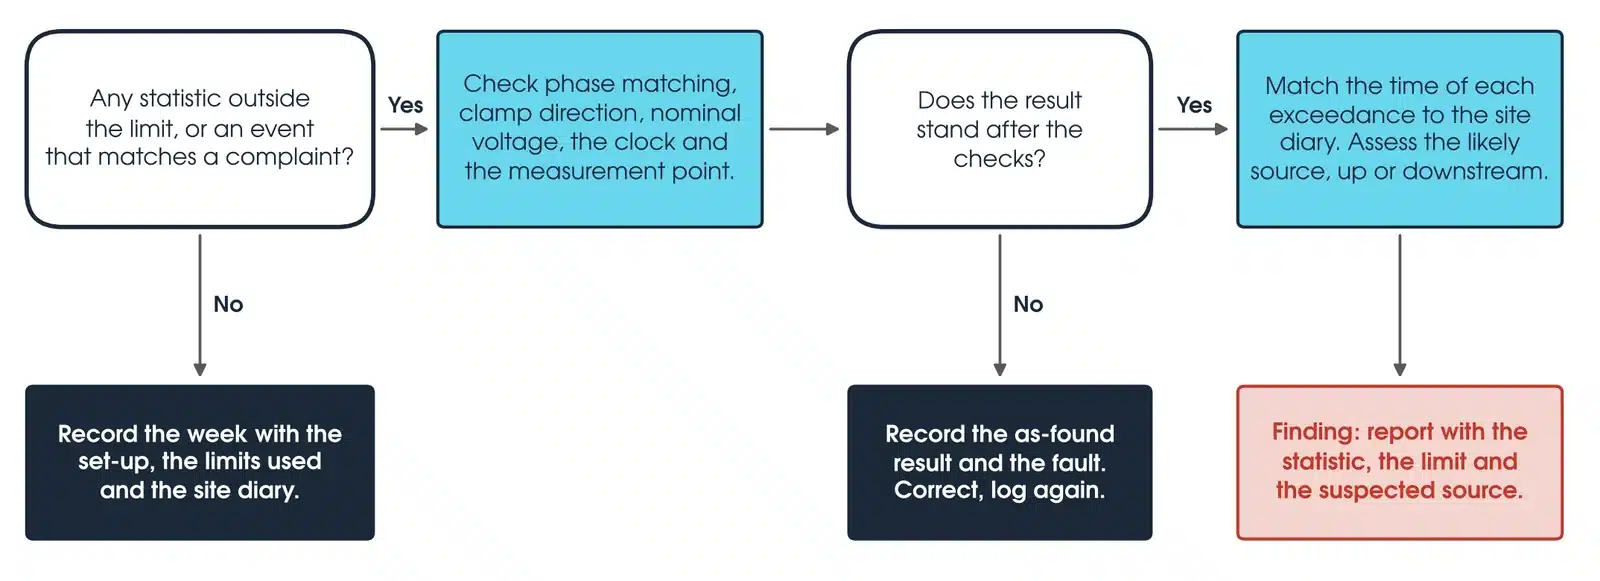
If any statistic is outside its limit, or an event matches a complaint, first check the set-up: phase matching, clamp direction, nominal voltage, the clock and the measurement point. If the result does not stand, record the as-found result and the set-up fault found, correct it and log again. If it stands, match the time of each exceedance to the site diary, assess whether the likely source is upstream or downstream, and report it as a finding with the statistic, the limit and the suspected source. Otherwise record the week with the set-up, the limits used and the diary.
How do I calculate TDD from a harmonic current result?
THD divides the harmonic current by the fundamental at the time; TDD divides it by the maximum demand current IL, the average of the monthly 15 or 30 minute maximum demand currents over the previous 12 months (IEEE 519-2022, clause 3.1): TDD = √(I5² + I7² + I11² + …) / IL × 100%.
Worked example: take one 10 minute interval at a 415 V PCC with I5 = 40 A, I7 = 20 A and I11 = 10 A, all other orders negligible, a fundamental of 300 A and IL of 600 A. The harmonic rms is √(1600 + 400 + 100) = 45.8 A. THD is 45.8 / 300 = 15.3%; TDD is 45.8 / 600 = 7.6%. With Isc/IL between 50 and 100, Table 2 allows 12.0% TDD and 10.0% for each order below the 11th, and I5 is 40 / 600 = 6.7%, so this interval is inside the limits, and the THD figure alone would have said it failed. Site compliance is judged by calculating TDD for every interval in the week, using all measured orders, and then taking its weekly percentiles; one interval does not establish it.
What should a power quality report include?
The measurement point and why it is the PCC; the instrument, class, probe types and ranges, wiring type, nominal voltage, clock source and logging period; the weekly 95th and 99th percentiles and daily 99th percentiles for voltage, each harmonic to the 50th, THD, TDD, unbalance, Pst and Plt against the named limit at that point; every dip, swell, interruption and transient with time, depth and duration, matched to the site diary and the network's records; and how IL and the network's fault level were established, since neither TDD nor the Isc/IL row can be stated without them.
What about harmonics from inverters and drives?
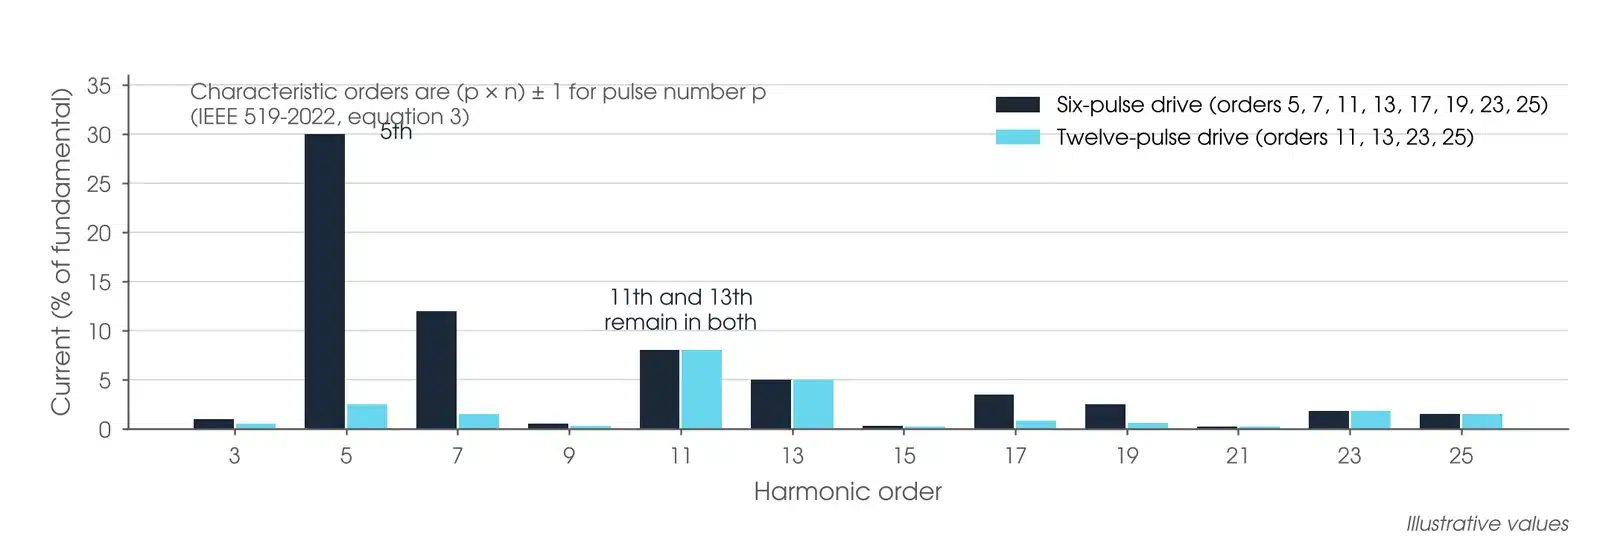
A rectifier with pulse number p produces characteristic harmonics at (p × n) ± 1: a six-pulse drive at the 5th, 7th, 11th and 13th, and a twelve-pulse drive at the 11th, 13th, 23rd and 25th (IEEE 519-2022, equation 3). Schneider CT199 gives typical current THD of 44% for an adjustable speed drive, 28% for a rectifier or charger, 53% for fluorescent lighting and 115% for single-phase data processing loads, whose 3rd harmonic adds in the neutral. Even harmonics and dc offset are not characteristic of a healthy converter; IEEE 519-2022 halves the even limits up to and including the 6th and does not allow dc offset (Tables 2 to 4, notes a and b).
Where the 5th and 7th are held below 25% of the Table 2 value, by filters, phase-shifting transformers or active front ends, IEEE 519-2022 Table 5 allows the remaining orders 1.4 times the limit, rising to 2.0 times when the 11th, 13th, 17th and 19th are also held. A capacitor bank whose natural frequency with the source sits near a harmonic order amplifies that order, because capacitor impedance falls with order (Schneider CT199, clause 3.2). To tell inside from outside, compare the spectrum at the PCC with the spectrum at the drive: the same orders rising together with site load point inward; a background that does not change with site load points to the network.
Inverter-based resources are treated differently. IEEE 519-2022 sends solar, wind and BESS installations at 10% or more of the site's annual average load to IEEE 1547 or IEEE 2800 for current limits (Figure 1). In Australia the network's connection agreement, drawn from AS/NZS 61000.3.6 and the National Electricity Rules, governs, and the survey at commissioning is the evidence of compliance with it.
Which power quality analyser should I use?
Class A for anything that will be submitted to a network or relied on in a connection assessment; Class S for troubleshooting and audits inside the site. The table shows what each class is for.
| Instrument | Class | Best used for |
|---|---|---|
| Class A analyser (IEC 61000-4-30) | Class A | Compliance surveys at the PCC, generator and BESS connection verification, transient capture to 6 kV at 200 kHz, GPS time stamping |
| Class S analyser | Class S | Troubleshooting, energy and harmonic audits inside the site, logging over days and weeks |
If you would rather have the survey done, Megavar's engineers run power quality surveys within high voltage testing, BESS commissioning and substation commissioning across Australia.
Download the power quality testing guide (PDF)
Frequently Asked Questions
How do I test power quality?
Connect a power quality analyser to the voltage and current at the point of connection, log for at least seven days with 10 minute aggregation, then compare the weekly statistics with the limits that apply at that point.
How is power quality measured?
By an analyser that calculates rms voltage every half cycle, harmonics over 10 cycle windows to the 50th order, flicker with a flickermeter and unbalance from sequence components, all aggregated to 10 minute values under IEC 61000-4-30.
What is the IEC standard for power quality?
IEC 61000-4-30 defines the measurement methods and Class A; IEC 61000-4-7 covers harmonic measurement and IEC 61000-4-15 the flickermeter. Emission limits in Australia come from AS/NZS 61000.3.6 and 61000.3.7 and the network's planning levels; IEEE 519-2022 is the limit set where a client or OEM specifies it.
What is a power quality analyzer?
A three-phase instrument that logs voltage, current, power, harmonics, flicker, unbalance and events over days. Class A analysers meet IEC 61000-4-30 for compliance work; Class S analysers are for troubleshooting.
Where is the point of common coupling?
The point on the network nearest the site where other users are or could be connected: the HV side of a dedicated transformer, or commonly the LV side of a shared one (IEEE 519-2022, clause 1.2).
How long should a power quality survey run?
Seven continuous days minimum, so the weekly 95th and 99th percentiles can be calculated (IEEE 519-2022, clause 4.4) and a full operating cycle is covered.
Do I need Class A?
For anything submitted to a network, used in a connection assessment or relied on in a dispute, yes. Class A results from two instruments can be compared; Class S results cannot be relied on for that.
Does Megavar carry out power quality surveys?
Yes. Our engineers run power quality surveys as part of commissioning and troubleshooting across Australia. Call 1300 730 499.
Need a power quality survey done?
Megavar runs power quality surveys across Australia as part of commissioning and troubleshooting. Call 1300 730 499 or email service@megavar.com.au.