Electrical thermal imaging finds connections, contacts and components running hotter than they should, on energised plant, without touching it. An infrared camera maps the surface temperature of switchboards, switchgear and substation plant under load, and a hot spot is judged by how far it sits above a similar component or the ambient air. It is also called electrical thermography, a thermographic inspection or an infrared inspection. This guide covers what the image can and cannot show, how much load the plant needs, how to inspect safely under live work rules and how to classify a finding.
Download the thermal imaging guide (PDF)

What is the main purpose of thermal imaging in electrical systems?
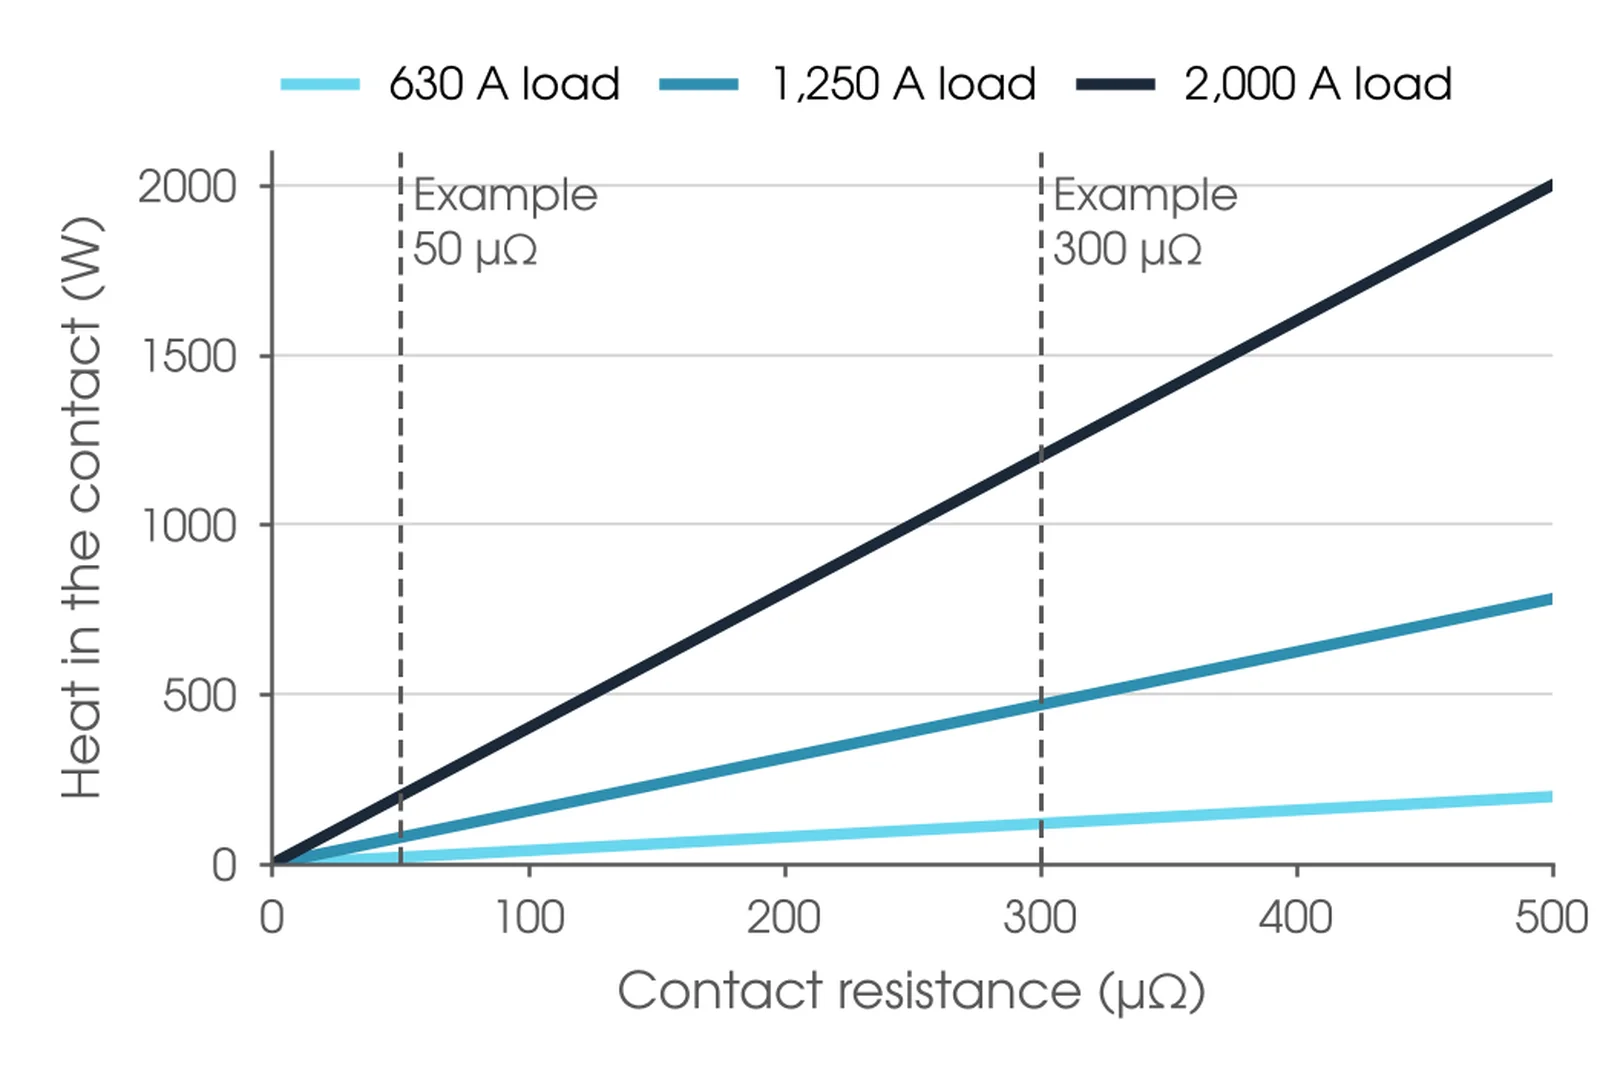
The main purpose is to find a connection or component that is turning into a heat source while the plant is energised and carrying load, before it fails. Power lost in a connection is P = I²R, so a loose or corroded joint turns load current into heat. Fluke reports a moulded case breaker terminal running more than 110 °C above its neighbours from a loose, arc-pitted termination that looked tight to the eye.
The problem feeds itself. Heat accelerates oxidation, oxidation raises resistance and higher resistance produces more heat; on a loaded board the end point is a burnt termination, a welded contact or a fire. A ductor test finds the same joint, but only on de-energised plant at an outage. Imaging sees the joint carrying its real load, so it can target the outage work, but it needs load to see anything.
When should electrical plant be thermally imaged?
At first load after commissioning, to set a baseline; on the asset owner's routine survey cycle, so results can be trended; after work on connections or contacts; after an overload, fault or trip; and before a planned outage, so ductor testing and repairs can be targeted at the joints that are already warm. IEEE C57.152-2025, Table 1, lists infrared as a recommended in-service test on transformer tanks, bushings and tap changers.

Where is electrical thermal imaging used?
Any energised, loaded plant with a surface the camera can see. The items below are the common ones, with what a hot spot usually points to and whether the reading is direct or indirect, which decides how it is classified.
| Item | What a hot spot points to | Reading type |
|---|---|---|
| LV switchboards, MCCs and distribution boards | Loose terminations, worn breaker contacts, phase imbalance, overloaded conductors | Direct, with doors open or through windows |
| MV switchgear | Hot cable terminations and busbar joints behind panels; only visible through inspection windows | Direct through a window; indirect through a cover |
| Outdoor substation busbar, clamps and disconnectors | Loose or corroded clamps, misaligned disconnector jaws, worn contacts | Direct, at a distance |
| Transformer bushings, tap changers and radiators | Bushing heating, tap changer contact heating, blocked radiators or failed fans; infrared is a recommended in-service test (IEEE C57.152-2025, Table 1) | Indirect: the fault is inside oil |
| Cable terminations and joints | Poor crimps, loose lugs, water ingress | Direct on bare lugs; indirect through insulation |
| Oil circuit breakers, bus ducts, pad mount transformers | Internal connection faults seen as a small surface rise | Indirect |
What should a hot spot be compared against?
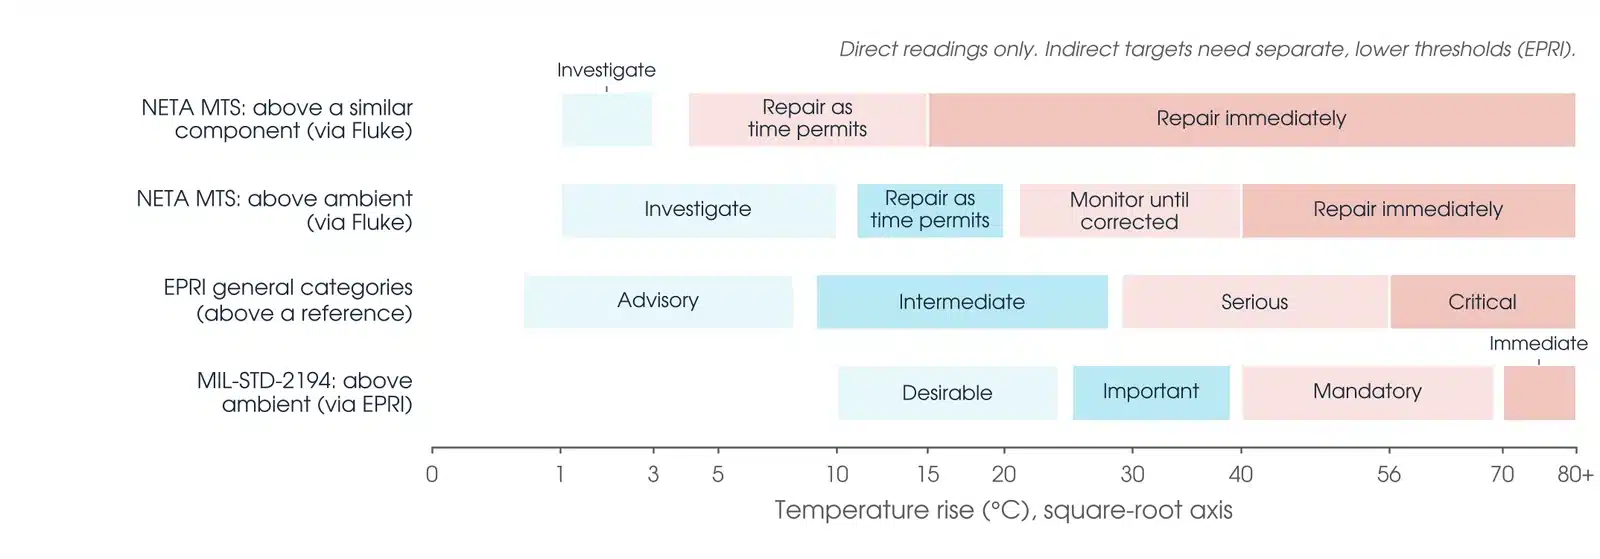
Two references are in common use. The first is a similar component under similar load: the same joint on the next phase. NETA MTS Table 100.18, as reproduced by Fluke, bands that difference at 1 to 3 °C, 4 to 15 °C and above 15 °C. The second is the ambient air; the same table bands the rise over ambient at 1 to 10 °C, 11 to 20 °C, 21 to 40 °C and above 40 °C. EPRI's general categories run from 0.5 to 8 °C (advisory) to above 56 °C (critical). Our recommendation is to use the asset owner's written severity criteria where they exist; where they do not, report the delta-T against a similar component and against ambient, state which scale was applied, and keep direct and indirect readings on separate criteria.
Direct and indirect matter more than the scale. A direct reading has little or nothing between the camera and the hot part: a bare lug, a busbar joint, a clamp, and the published bands apply. An indirect reading is of a fault behind oil, insulation or a cover. EPRI measured an internal bus duct rise about 25 times the rise on the duct surface, and reports a 5 °C rise on an oil circuit breaker often indicating a critical problem. Never apply direct-reading bands to an indirect target: one organisation that used 10 °C as its report threshold for everything left an 8 °C rise unreported, and a fire followed three weeks later (EPRI).
How does electrical thermal imaging work?
Every surface emits infrared energy with its temperature. The camera receives that energy plus whatever the surface reflects from its surroundings, and converts the total to a temperature using the emissivity and reflected temperature it has been given. Emissivity is the fraction of energy a surface emits compared with a perfect emitter: Fluke's table gives 0.01 for polished copper, 0.05 for polished aluminium, 0.88 for copper oxidised black and 0.95 for black electrical tape. Bare, shiny metal emits little and reflects a great deal, which is why a shiny lug can read cooler than the tape beside it at the same temperature.
On a high emissivity, moderately warm surface inside the camera's measurement resolution, Fluke gives typical accuracy of ±2 °C or 2% of the reading. Below an emissivity of about 0.6 the error grows quickly, and EPRI puts the practical limit at 0.5; below that, use a high emissivity target, or fit tape or paint only during an authorised isolation with the plant proved de-energised, never on live conductors. If the target is at the same temperature as its background, the camera reads that temperature whatever emissivity is set (EPRI); emissivity errors appear only where there is a real difference.
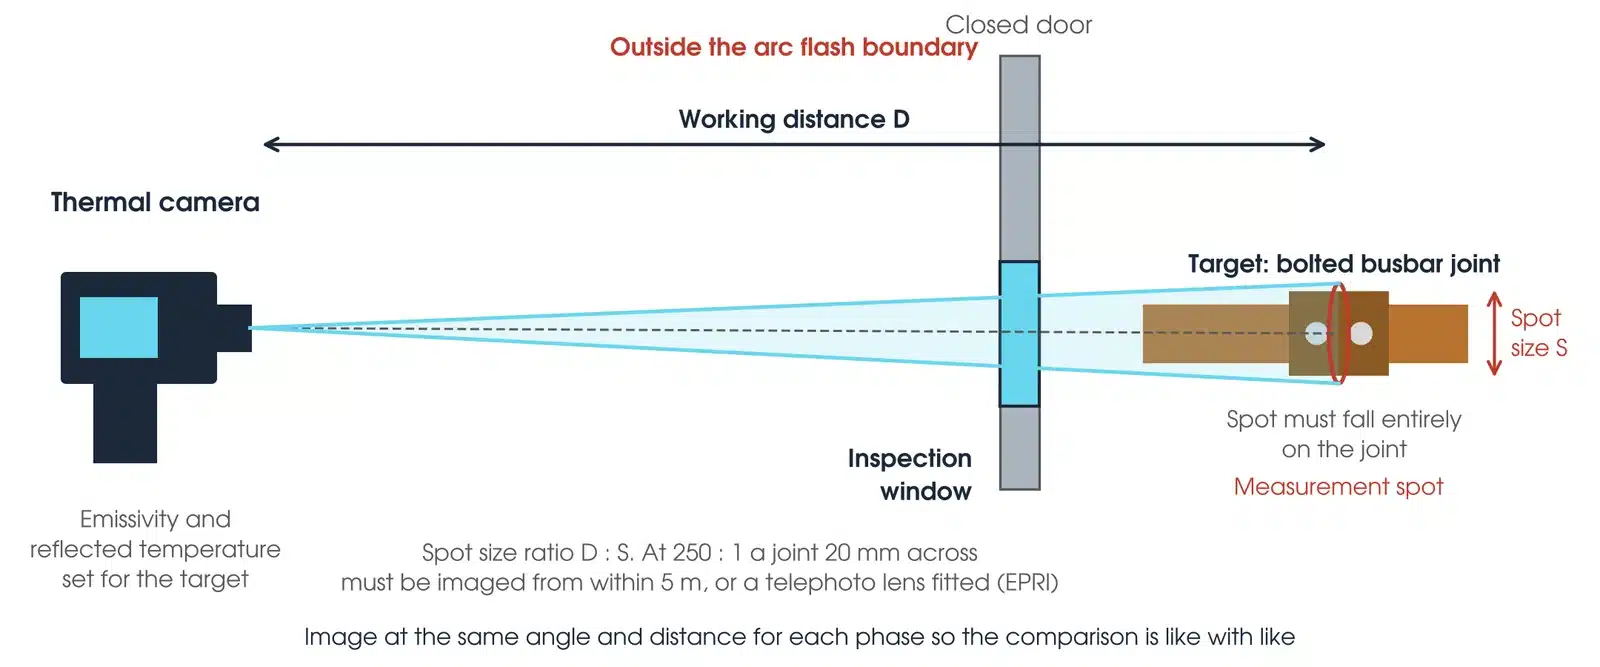
Distance and focus set what the camera can measure. A spot size ratio of 250:1 means a target 1 unit across needs the camera within 250 units (EPRI), so a joint 20 mm across must be imaged from within 5 m or with a telephoto lens; a target smaller than the measurement spot reads cooler than it is. EPRI shows a focused hot spot losing about a third of its measured rise when defocused at the same distance, and focus matters most on small targets against a cold background such as sky.
How do I set up a thermal imaging survey safely?
The plant stays live and loaded, so the survey is energised electrical work under the WHS Regulations. The Safe Work Australia model Code of Practice, Managing Electrical Risks in the Workplace, allows energised work only where an exception applies, such as the equipment needing to be energised for the work to be done properly, and never because it is merely more convenient. Four things come before the camera is raised:
- A competent person assesses the risk, including arc flash from high fault levels, and the work follows a safe work method statement with suitable, tested PPE. A safety observer is required unless the work consists only of testing and the assessment shows no serious risk.
- Where inspection windows are fitted, image through them with the enclosure closed. Open a door or remove a cover only under the asset owner's live work rules and permit.
- Keep outside the arc flash boundary from the asset owner's arc flash study, in the PPE it calls for. Nothing enters the enclosure.
- Never remove covers from energised MV switchgear without an approved method from the asset owner. Without windows, the terminations wait for the next outage.
Fluke warns that opening a door can trigger an arc flash if the latch is defective or dust, debris or pests inside are disturbed, and that an arc can exceed 16,650 °C in under half a second; only authorised, trained people open enclosures containing energised equipment. EPRI's rule for the camera itself is stop, look, identify the plant and its hazards, then raise it, and where a safe distance cannot be kept, freeze the image and leave. Opening a cabinet also lets cooling air in: EPRI records a hot connection that faded within minutes of the door opening.
How is a switchboard thermal imaging survey set up?
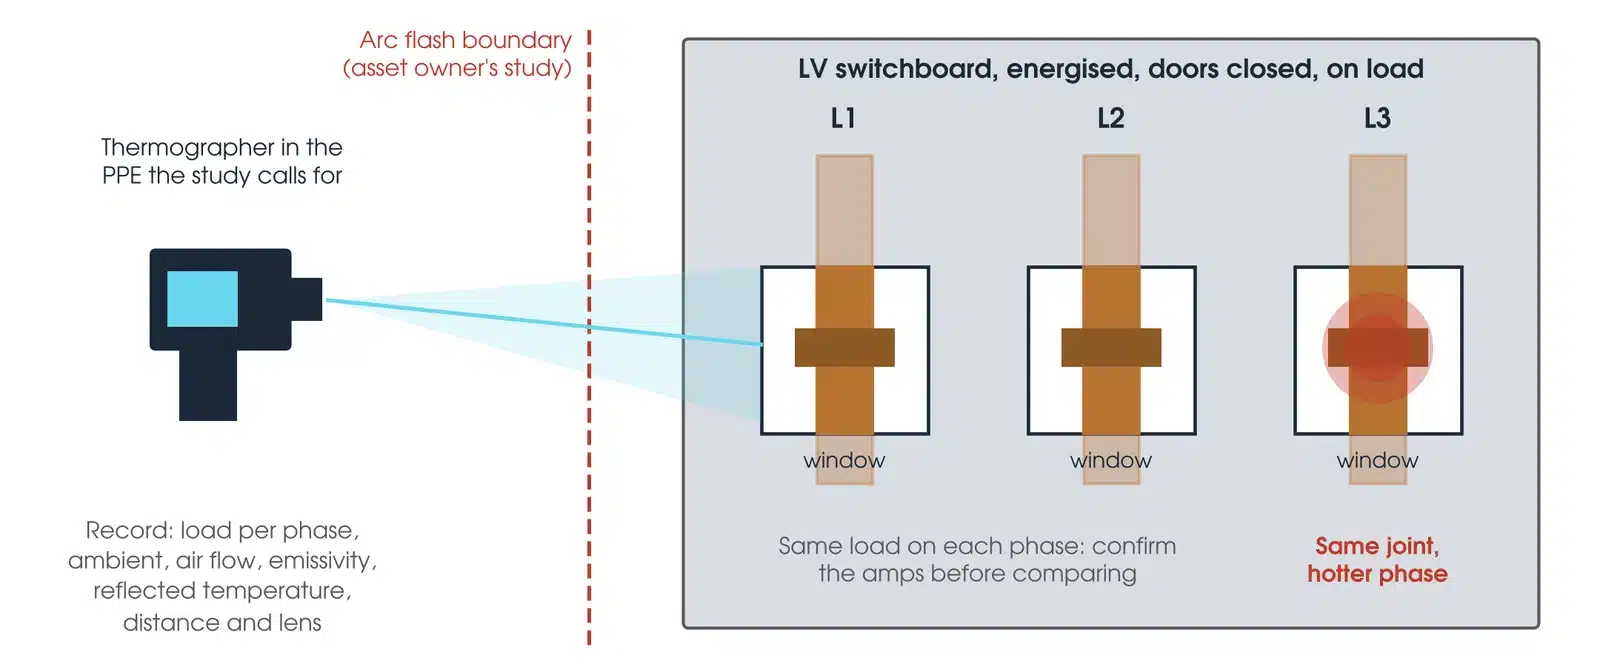
Image each phase from the same position through the fitted windows, with the board on load and the doors closed, and compare L1, L2 and L3 at the same joint. Confirm the amps on each phase before comparing, and record load, ambient, air flow, emissivity, reflected temperature, distance and lens with the images.
This guide describes general practice for trained thermographers and competent electrical personnel. It is not a work procedure. Work under the asset owner's safety rules, live work rules and arc flash study, the access permit and a site-specific safe work method statement. Manufacturer and asset owner criteria take precedence over the general guidance here.
How do I make the measurement?

- Confirm load. Read the load on each phase and confirm it has been steady. EPRI notes a problem area can take up to an hour to reach its full temperature after a load change. Record the amps.
- Set the camera. Enter the emissivity for the surface and the reflected temperature; when imaging through a window, also enter its verified transmission and temperature compensation. Select a temperature range above the hottest target expected.
- Focus and distance. Work within the spot size ratio for the lens fitted, focus sharply on the target and image from the same angle for each phase.
- Scan and compare. Scan the board or bay for any component that differs from its neighbours, then image each suspect joint with its reference phase in the same frame.
- Measure delta-T. Place spots on the hot component and the similar component, and measure ambient air with a separate temperature sensor. Record both differences.
- Record conditions. Load, ambient temperature, wind or air flow, sun, emissivity and reflected temperature used, distance and lens, direct or indirect reading.
- Report. Classify each finding on the stated scale, pair the thermal image with a visual image, and name the location so the repair crew finds the same joint.
A phase that is cooler than its neighbours can be a finding too: a failed or open component carries no current and no heat (Fluke).
What are the common electrical thermal imaging mistakes?
| Mistake | What it does to the result |
|---|---|
| Surveying at light load | A high resistance joint at 20% load may show no rise at all. Fluke notes some standards recommend 40% minimum load or the highest normal load |
| Reading bare metal as measured | A shiny lug at emissivity 0.1 reflects its surroundings; the number on screen is not its temperature |
| Taking a reflection for a hot spot | A hot spot that moves when the camera moves is a reflection. The reflected background still has to be compensated after it moves out of view (EPRI) |
| Too far away | Beyond the spot size ratio the hot spot is diluted by its surroundings. EPRI records a rise dropping from about 96 °C to 89 °C with distance alone |
| Ignoring wind and air flow | EPRI reports a 5 km/h breeze cutting the rise of a hot spot in half, and recommends surveys below about 16 km/h. Air conditioning does the same indoors |
| Classifying an indirect target as direct | A small surface rise over oil or insulation can be a serious internal fault |
| Load not recorded | Without the amps, the finding cannot be classified or compared with the next survey |
How do I read a thermal imaging result?
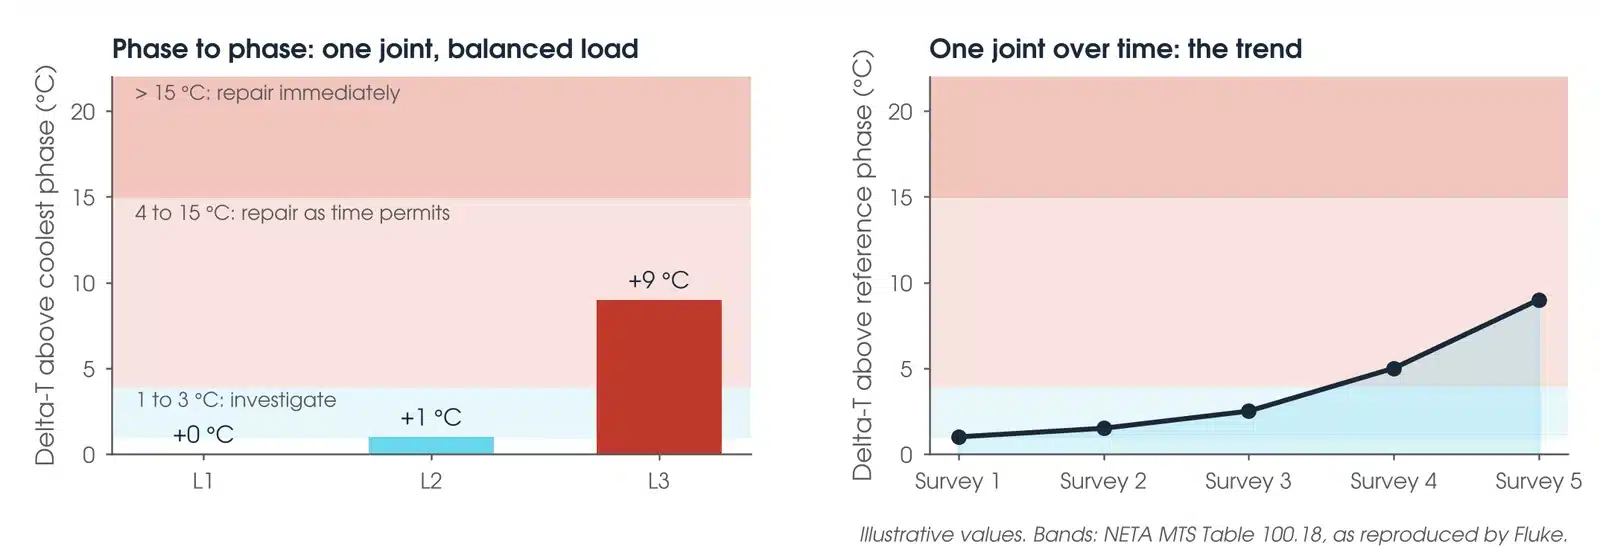
A hot spot is judged four ways: against a similar component under similar load, against the ambient air, against the asset owner's written severity criteria, and against the joint's own history. A joint can sit in the lowest band and still be deteriorating.
What temperature difference is acceptable on a switchboard?
There is no single acceptable value in an Australian standard; the bands come from publishers and the asset owner. NETA MTS Table 100.18, as reproduced by Fluke, gives for a similar component under similar load: 1 to 3 °C a possible deficiency that warrants investigation, 4 to 15 °C a probable deficiency to repair as time permits, above 15 °C a major discrepancy to repair immediately. Over ambient the same table gives 1 to 10 °C investigate, 11 to 20 °C repair as time permits, 21 to 40 °C monitor until corrected, above 40 °C repair immediately. Fluke describes the table as reasonable guidance in the absence of a consensus standard. Where the asset owner has written criteria, they apply; EPRI recommends every programme writes its own, with temperature rise as a key parameter and direct separated from indirect.
Over time, compare with the last survey at a similar load. A joint that is a little warmer every survey is deteriorating even while it stays in the lowest band.
What does a bad thermal imaging result look like?
| Pattern | What it usually means |
|---|---|
| One phase hotter at one joint | With balanced load, a high resistance connection at that joint. Check the load first: Fluke's example of 30/70/30 A loading is imbalance, not a bad joint |
| One phase cooler | A component that has failed open, a blown fuse or a lost phase |
| A whole board warm | Overload, blocked ventilation or a hot room rather than a single joint. Compare with ambient and with the room |
| A small rise on an indirect target | Treat it as potentially serious. EPRI: a problem seen on an indirect target at partial load is probably already critical |
| A hot spot that moves | A reflection of a lamp, the sun or the thermographer |
Is my result OK?
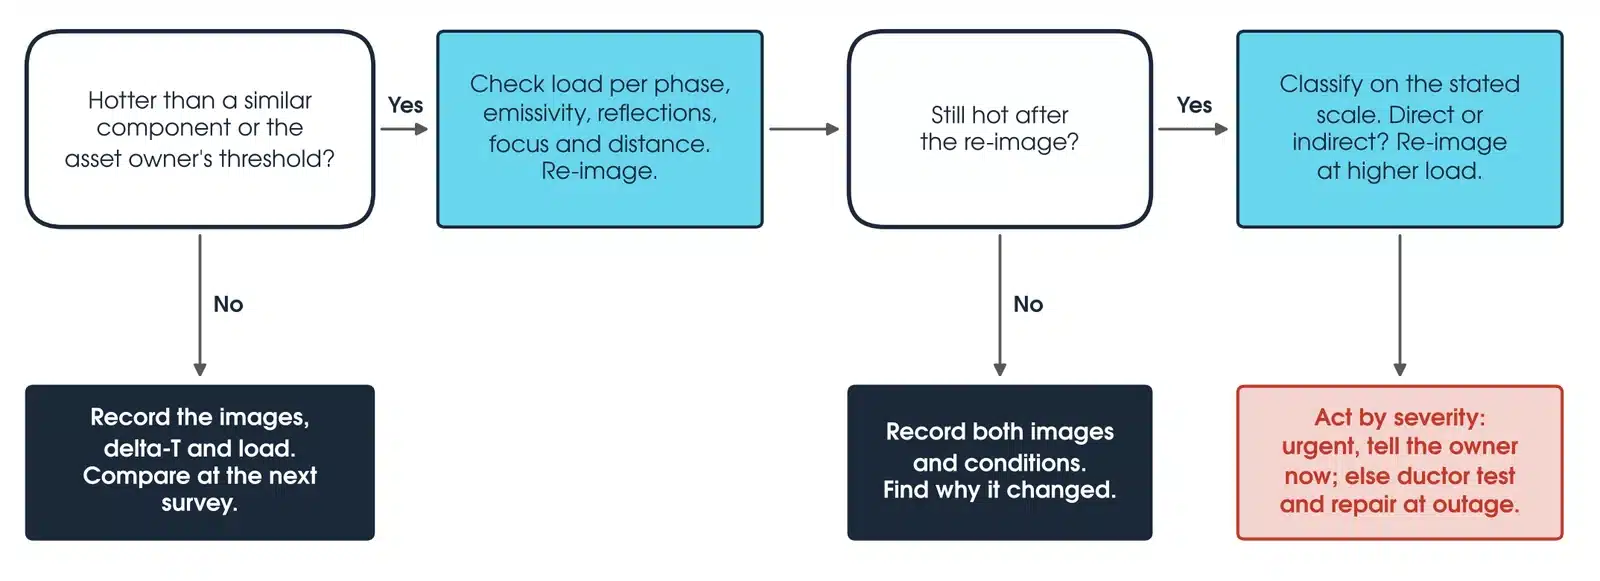
If a component is hotter than a similar one, or above the asset owner's threshold, check the load per phase, the emissivity and reflected temperature set, reflections, focus and distance, and re-image. If the re-image reads normally, record both images with their load, conditions and settings and find why the reading changed: a real load imbalance or intermittent heating is a finding, not a reason to discard the first image. If it is still hot, classify it on the stated scale, note whether the reading is direct or indirect, re-image at higher load where possible, and report it as a finding with an action set by severity: for an immediate-action finding, notify the asset owner at once for risk control, load reduction or isolation; otherwise ductor test and repair at the outage.
How do I correct a thermal imaging reading for load?
Heat is I²R, but EPRI shows temperature rise does not follow the square of the load change: radiation varies with the fourth power of temperature, and the measured exponent lies between about 0.6 and 1.8. The full load rise is the measured rise multiplied by (100 / % load) raised to that exponent, and the square law (exponent 2) is the maximum. EPRI reports full load typically moving a direct finding up one, two or even three categories.
Worked example: a joint reads 8 °C above its reference phase at 50% load. The square law gives 32 °C at full load; EPRI's exponent range gives 12 to 28 °C. Report the measured 8 °C and the load, note the finding may be two categories higher at full load, and re-image under load rather than reporting a calculated number as measured.
What should a thermal imaging report include?
For each finding, the thermal and visual image, location, hot spot temperature, delta-T against a similar component and against ambient, and the scale used to classify it; the conditions, meaning load per phase, ambient, wind or air flow, sun, emissivity and reflected temperature set, distance and lens, and whether the reading is direct or indirect; the change since the last survey at a comparable load; and the camera model, serial number and calibration date with the thermographer's certification.
How do I classify a hot spot?
Three published scales are in use, and they do not agree, so a category without a named scale cannot be checked. NETA MTS Table 100.18, as reproduced by Fluke, bands delta-T against a similar component under similar loading (1 to 3, 4 to 15, above 15 °C) or against ambient (1 to 10, 11 to 20, 21 to 40, above 40 °C), with a recommended action for each band. EPRI's general categories are rise above an established reference: advisory 0.5 to 8 °C, intermediate 9 to 28 °C, serious 29 to 56 °C, critical above 56 °C. MIL-STD-2194, as reproduced by EPRI, bands rise above ambient: desirable 10 to 24 °C, important 25 to 39 °C, mandatory 40 to 69 °C, immediate 70 °C or more.
All three are written for direct readings. EPRI's position is that any published criteria that do not separate direct from indirect ought to be revised, so use separate, lower thresholds for indirect targets. Temperature is not the only input either: EPRI weighs load, spot size and distance, wind, emissivity, ambient and background, sun, and how direct the reading is before assigning severity, and then the criticality of the plant. State the scale, the reference used and the load with every classification.
Which thermal imaging camera should I use?
One camera covers the work in this guide; the lens changes with the standoff. It is available calibrated, with lenses and software, from Megavar.
| Instrument | Resolution and range | Best used for |
|---|---|---|
| FLIR E75 | 320 × 240; -20 to 650 °C; 42°, 24° and 14° lens options | Switchboards, MCCs and switchgear through inspection windows; outdoor substation busbar, clamps and bushings at a safe standoff with the telephoto lens |
The camera is available from Hobart, Launceston, Adelaide and Newcastle through Megavar's thermal imaging camera hire, and the joints it finds are confirmed at the outage with a micro-ohmmeter. If you would rather have the survey done, Megavar's AINDT-certified thermographers survey within substation maintenance, substation commissioning and circuit breaker testing across Australia.
Download the thermal imaging guide (PDF)
Frequently Asked Questions
What is the main purpose of thermal imaging in electrical systems?
To find connections, contacts and components running hotter than their neighbours while the plant is energised and loaded, before they fail. Most of the work is comparing one phase or joint with a similar one under the same load.
What are the electrical thermal imaging standards in Australia?
There is no Australian standard that sets hot spot limits. ISO 18434-1 gives general thermography procedures and ISO 18436-7 the thermographer certification framework that AINDT administers; energised work sits under the WHS Regulations and the Safe Work Australia Code of Practice, with AS/NZS 4836 for LV work. Severity bands come from publishers such as NETA and EPRI and from the asset owner.
Can electricians do thermal imaging?
Yes, with training. The camera is simple; the interpretation is not. Fluke notes imagers are often used ineffectively, and EPRI shows how load, wind, distance and emissivity change the reading. Asset owners commonly specify AINDT-certified thermographers for survey work.
How much load does the plant need?
Enough to make a bad joint warm. Fluke notes some standards recommend a 40% minimum load or the highest normal load, and EPRI reports many thermographers will not survey below 40 to 50% load.
Can the camera see inside sealed switchgear?
No. It sees surfaces. Fit inspection windows, or treat the reading as indirect with its own lower thresholds, and use ductor testing at the outage.
Why does bare copper read cooler than the tape next to it?
Emissivity. Polished copper is about 0.01 and black tape 0.95 (Fluke). The copper reflects its surroundings instead of emitting; the two can be the same temperature.
How often should switchboards be surveyed?
At the interval in the asset owner's maintenance plan, adjusted for criticality, condition and previous findings. Re-image after a repair under comparable load.
Does Megavar survey as well as hire?
Yes. Our AINDT-certified thermographers survey substations, switchboards and renewable plant across Australia. Call 1300 730 499.
Need a thermography survey done, or the camera to do it?
Megavar surveys substations, switchboards and renewable plant across Australia with AINDT-certified thermographers, and hires the FLIR E75 in this guide. Call 1300 730 499 or email service@megavar.com.au.